Master Multiplication with a Color-Coded Chart 0-12
When you're helping a child grasp multiplication, a well-designed tool can make all the difference. The Multiplication Times Table Chart 0-12 is more than just a grid of numbers—it's a thoughtfully crafted learning aid that uses color families and intuitive layout to turn memorization into a visual, almost tactile experience. For designers, educators, parents, and content creators, understanding how this chart works offers insight into how design principles can support practical learning.
How Color Families Guide the Learning Process
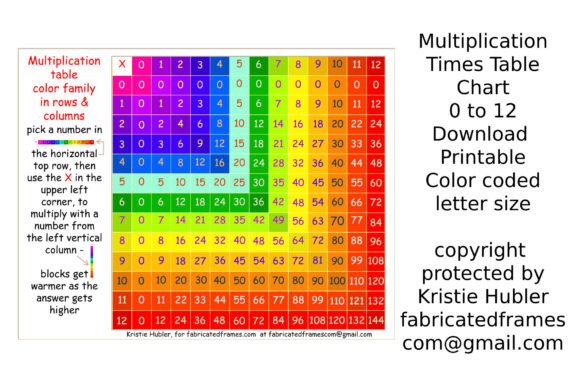
This chart isn’t just randomly colored. It uses the color wheel—12 shades moving from pink through cooler tones and back to warmer hues—to create a visual progression that mirrors the increasing values of the numbers. A child starts at the left column, locates a number, follows the red “X” as a reminder to multiply, then finds the corresponding number along the top row. The color family coordination helps them visually track across rows and columns, reducing confusion and reinforcing number relationships. It’s a subtle but effective way to use color as a navigational aid, not just decoration.
The choice of Comic Sans font is deliberate here—it’s familiar, easy to read for young learners, and avoids the intimidation that more formal typefaces might introduce. But there’s also a version with a custom “Fabric Font,” which adds a playful, textured feel. Mixing up fonts like this isn’t just for fun; it exposes children to different typographic styles, which can support visual discrimination skills over time. For designers, it’s a reminder that font choice isn’t just about aesthetics—it’s about context and audience.
Practical Applications Beyond the Classroom
While this chart is obviously a teaching tool, its design principles have broader applications. If you’re creating educational materials, children’s books, or interactive learning apps, the use of color families and clear typographic hierarchy can be adapted to your own projects. The Multiplication Times Table Chart 0-12 demonstrates how a structured, visually guided layout can simplify complex information—something that’s valuable in everything from infographic design to user interface layouts.
For marketers and content creators, there’s a lesson in audience awareness here. The chart doesn’t try to be overly sophisticated; it meets the child where they are, using familiar fonts and intuitive color cues. That same principle applies when designing for any audience—whether you’re choosing a sans serif font for a tech startup’s website or a handwritten font for a boutique brand’s packaging. The key is aligning the visual language with the user’s needs and expectations.
Design Choices That Support Retention and Engagement
One of the standout features of this chart is how it uses visual cues to build memory pathways. The red “X” acts as a consistent anchor point, while the color progression helps with pattern recognition. For designers working on brand identity or editorial layouts, this is a useful case study in how to guide a viewer’s eye and create a sense of flow. It’s not about flashy graphics—it’s about thoughtful organization.
If you’re evaluating design assets for a project—whether it’s a premium font, a set of icons, or a template—consider how elements work together to support clarity and recall. The Multiplication Times Table Chart 0-12 succeeds because every design choice, from font to color to layout, serves a functional purpose. That’s a mindset worth adopting in your own work, whether you’re designing social media graphics, packaging, or web content.
Choosing the Right Tools for Your Creative Projects
When selecting fonts or design elements, context is everything. A script font might work beautifully for a wedding invitation but fall flat in a technical manual. Similarly, the Comic Sans font used in this chart is perfect for its intended audience but might not suit a corporate report. Always test how a typeface performs in its intended environment—consider readability, emotional tone, and compatibility with other design assets.
For those interested in exploring more creative fonts, the “Fabric Font” mentioned in the chart’s description is an example of how custom typography can add personality. It’s available as a downloadable asset, which highlights the growing market for premium, niche fonts. Whether you’re a blogger looking to refresh your site’s typography or a small business owner crafting brand materials, investing in a versatile font family can elevate your visual communication.
Ultimately, the Multiplication Times Table Chart 0-12 is a reminder that good design is often quiet and purposeful. It doesn’t shout for attention; it simply works. And in a world saturated with visual noise, that kind of clarity is something worth striving for in your own creative projects.